The Atlantic hurricane season extends from June 1st through November 30th. To start the season off, below you can find information about hurricanes and a prediction for the season.
A hurricane is a storm with a closed center of circulation, maintaining winds at least 74mph (67 knots). It is a system of low level clouds. The clouds include a surface wind circulation and a warm core. Storms maintain or increase strength by drawing heat energy from the ocean and exporting heat through the upper Troposphere. The Troposphere is the lowest region of the atmosphere and includes up to 6.2 miles from the earths surface. The intensity of the storm is determined by the speed of the wind around the center of the storm. The wind speed (in miles per hour) classify storms, and those classifications are listed from weakest to strongest below.
Tropical Depression: 38 or less
Tropical Storm: 39-73
Hurricane by Category:
1) 74-95
2) 96-110
3) 111-129
4) 130-156
5) 156 and above
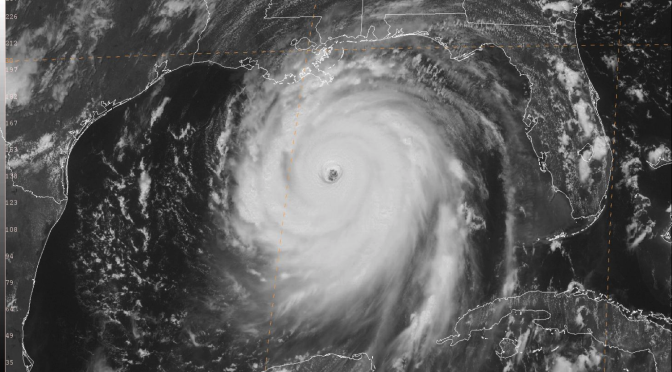
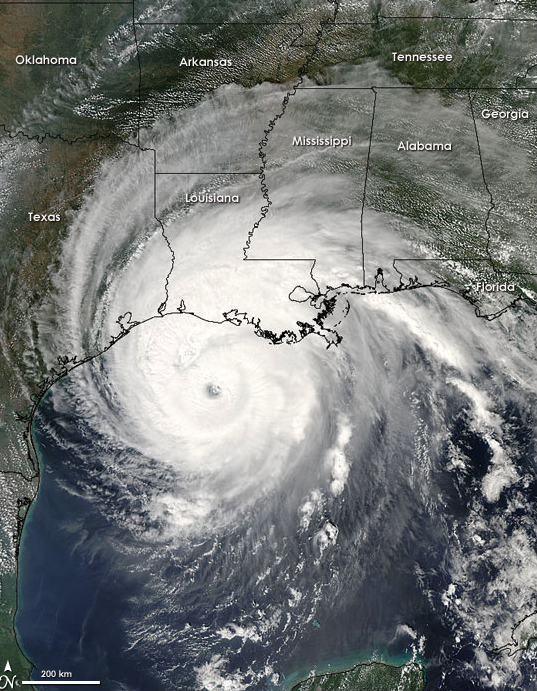
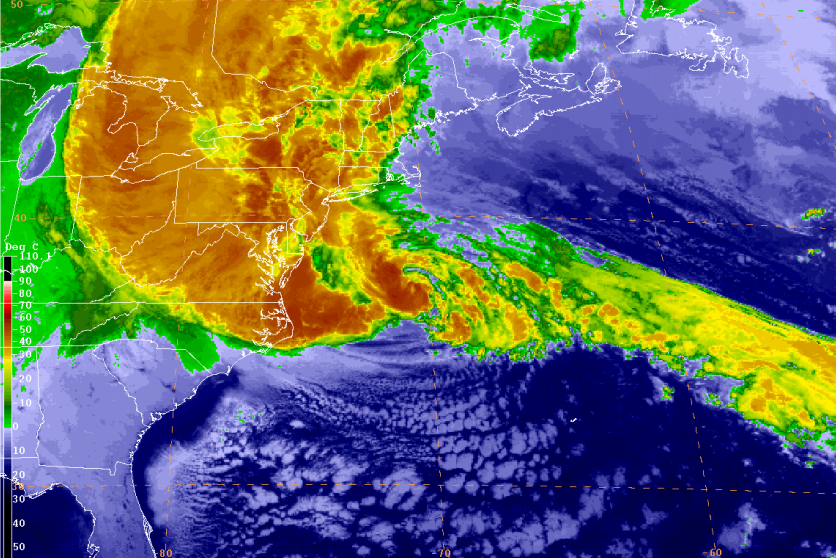
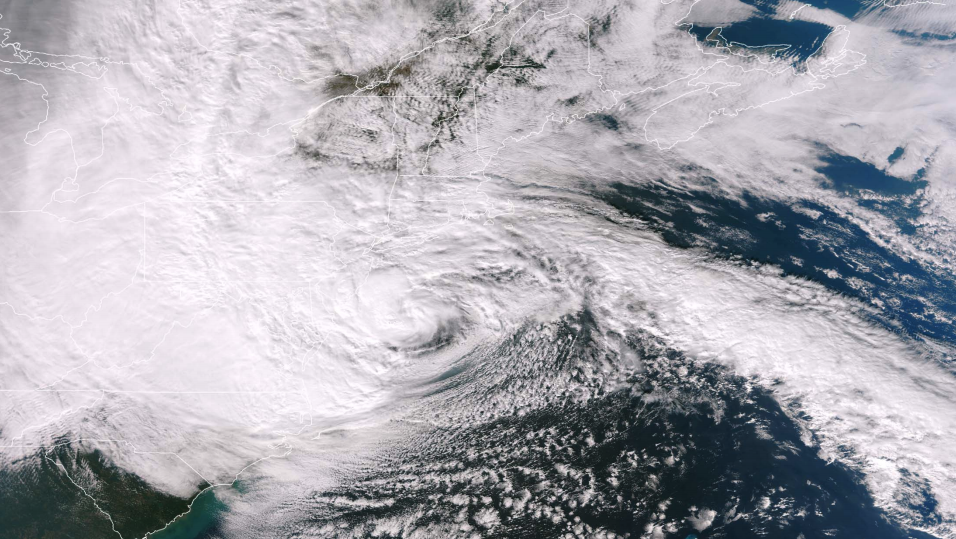
Nasa’s Aqua satellite captured this image of Hurricane Rita in 2005.
When a storm forms in the western Pacific it is called a typhoon. When a storm forms in the Atlantic basin or eastern Pacific, the storm is a hurricane. North America is only impacted by hurricanes. Countries like Japan, Taiwan, and the Philippines are impacted by typhoons. In addition, storms rotate in one direction on one side of the earth, and yet another on the other side of the earth. Storms spin counter-clockwise in the northern hemisphere and clockwise in the southern hemisphere. These different rotations are due to the Coriolis Effect.
The global climate and ocean conditions impact the strength and frequency of storms. As we go through the season, each additional month increases the likelihood of a storm forming. There is a considerable spike in the number and strength of systems likely to occur between August and around mid October. September has historically and reliably been the most active month during the tropical season.
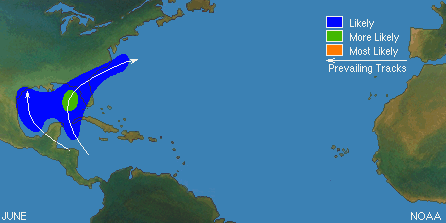
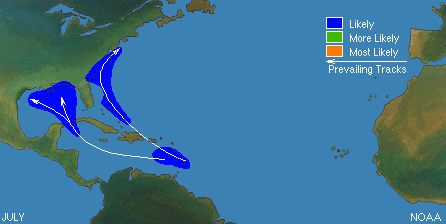
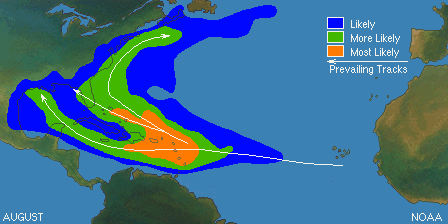
The general pattern of month specific storm tracks have been mapped by the National Hurricane Center. The storm tracks below are not completely accurate every single year. These tracks are created with probability estimations. They simply represent trends that often occur during these months of the year, as you can see by the likelihood indication colors.
The impact storms can have on the gulf, from month to month, are noted below.
June: Storm tracks appear almost entirely through the Gulf of Mexico.
July: Storms travel up the gulf route like they do along the Atlantic side of the Carribean islands.
August: Storms travel up the center of the gulf usually making landfall near Texas and Floribama, with little deviation from that track. This is typically the ideal storm track for west Florida.
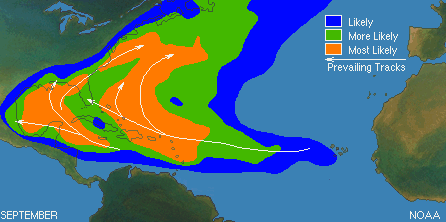
September: The storms that affect the gulf appear to form mostly down in the waters between Haiti and Columbia/Panama. They travel into the gulf, going either into the big bend or into southern Mexico. Although these aren’t ideal storm tracks, this is the month for strong storms. Any storm that enters the gulf with hurricane 2 status or above will send super fun waves.
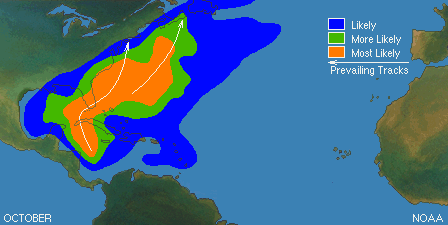
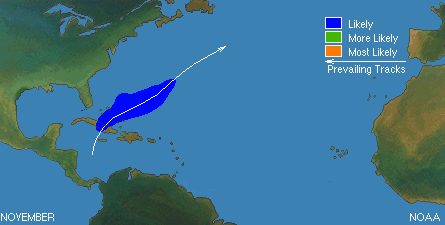
October & November: Storms travel along the gulf side of the Carribean Islands but they are almost always diverted toward the Atlantic near the southern tip of Florida.
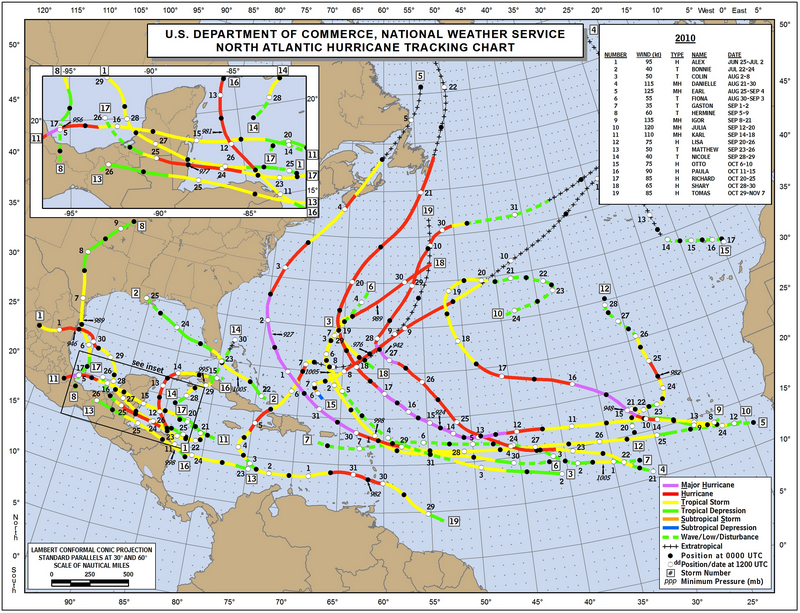
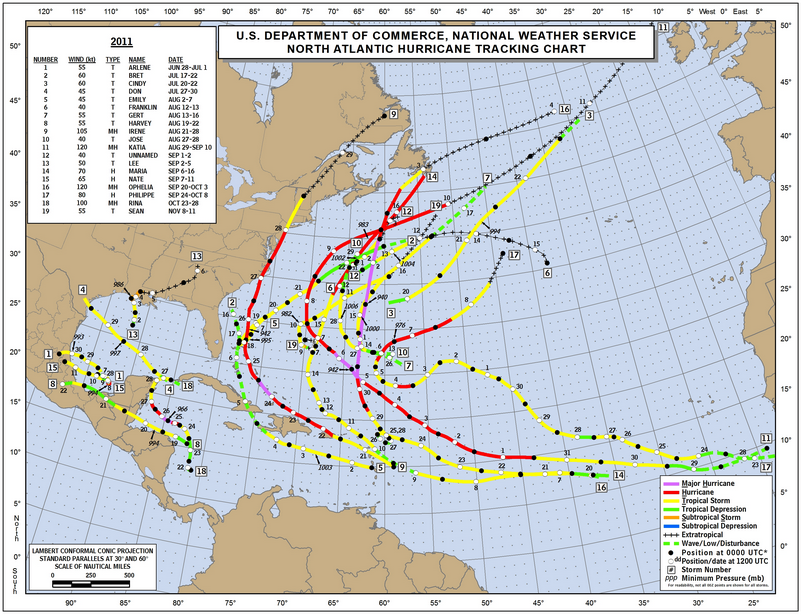
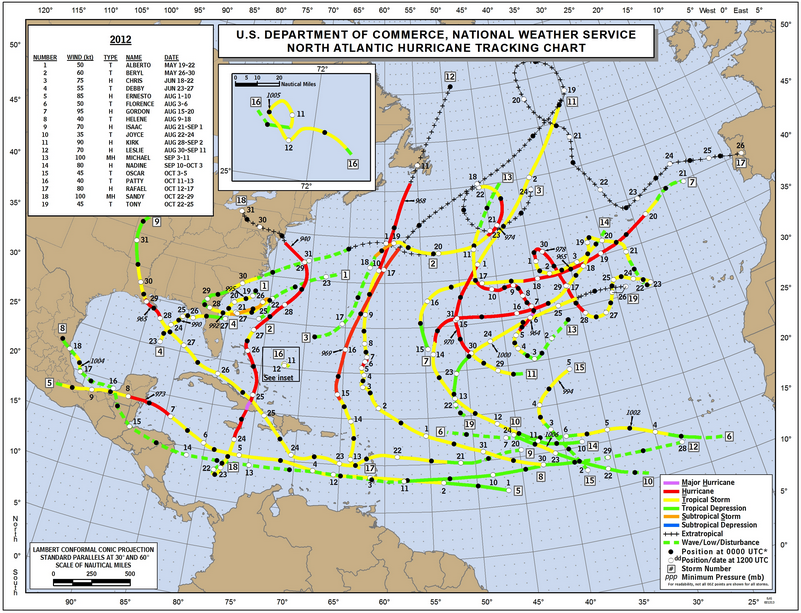
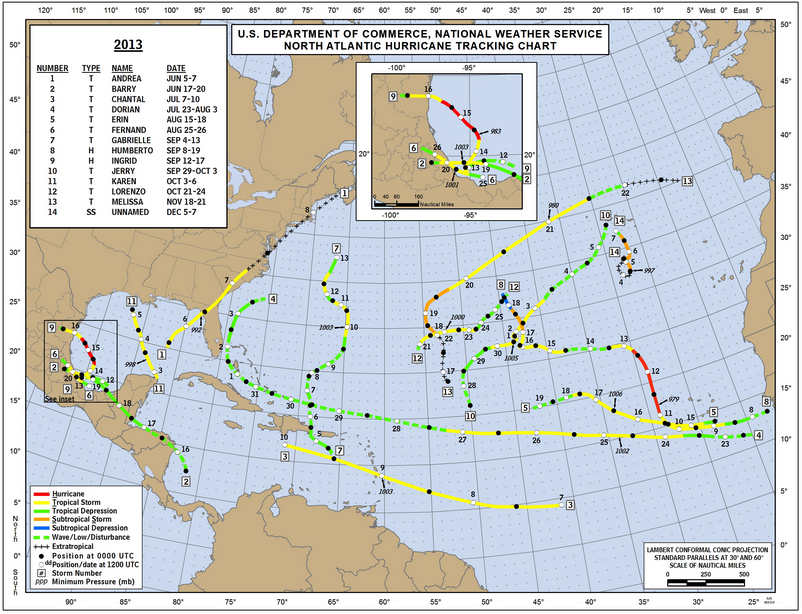
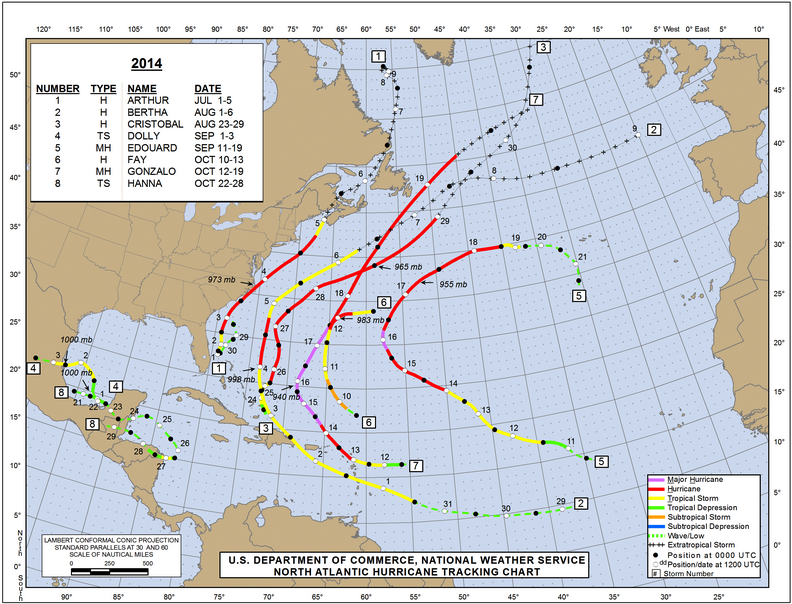
We can see the above storm patterns varying from month to month. You should also know that storm patterns vary from year to year. The Atlantic basin has the largest year-to year variability, when compared to other regions that experience cyclones(according to NHC). Subsequently, the precise patterns of storms are difficult to predict, much like any type of weather. Below you will find the images of storm tracks from the past 5 years. The images have been created by the National Hurricane Center.
Storms form either in tropical or subtropical latitudes, and can rapidly intensify. Rapid intensification occurs when a storm quickly grows in strength. Rapid intensification occurs when a storm’s maximum sustained winds increase by at least 30 knots in a 24 hour period. Storms make landfall when the center collides with a continent or island.
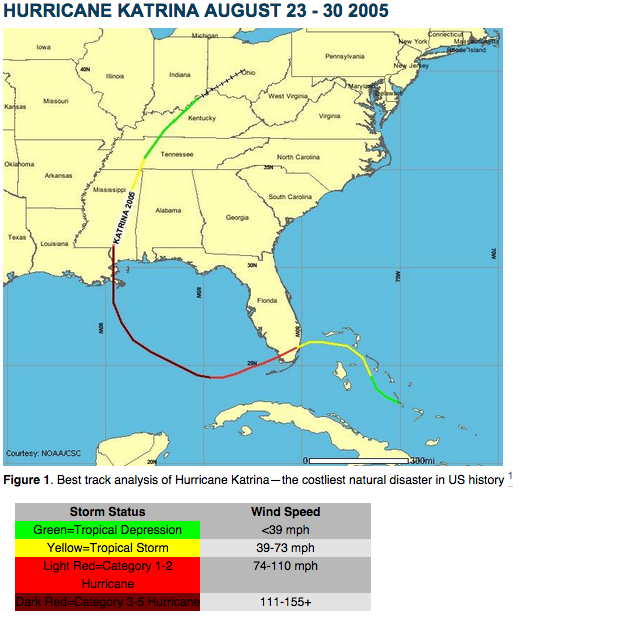
Tropical cyclones can cause considerable destruction and death. Hurricane Katrina was a devastating storm that formed during the summer of 2005. This storm leveled the entire city of New Orleans. Hurricane Katrina was one of the most powerful and costly storms in history. Although the storm was only a category three when it made landfall it caused considerable damage and death. The national hurricane center reported over 1500 casualties, and a New Orleans newspaper reported over 100 billion dollars in damages.
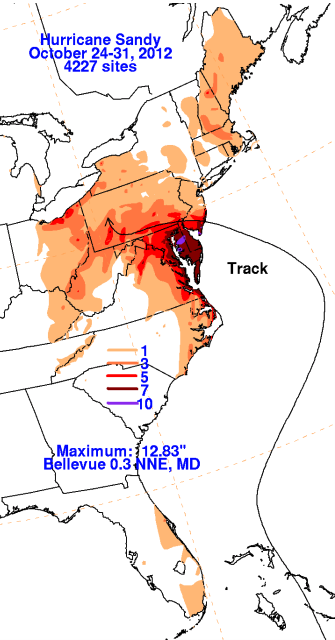
After Katrina, Sandy was another major hurricane which caused considerable damage. Sandy devoured the northeast, making landfall in New Jersey. The death toll incurred by Sandy was 150 individuals. This storm created around 50 billion dollars in property damage just in the United States. There are quite a few high quality images in this National Hurricane Center presentation. The images do a good job to portray the damage from Hurricane Sandy.
Recently, university researchers ran statistical analyses to determine what our odds are for hurricanes in the Atlantic basin. Phillip Klotzbach and William Gray at Colorado State University published a document on April 9th (link here), and it includes a detailed prediction for the 2015 hurricane season. In summary, they expect this season to be one of the least active seasons since the middle of the 20th century. They are suggesting that because the tropical and subtropical waters of the Atlantic are cool, storms will be infrequent and weak. Additionally, they expect a moderate El Nino event to begin during the Fall (September 23 is the start of Fall). Over the past 33 years these researchers have been accurate regarding above or below average seasons at a rate of 70%. They expect to see around 7 storms, three of them being named storms, and only one major hurricane. Because of Ana, which formed before the start of the season, the prediction is now at 8 total storms. Also, the recent update includes a strong El Nino prediction.